PythonPart function profiling with cProfile
Performance profiling of the functions with cProfile is supported by the PythonParts framework class ProfileUtil such as
ProfileUtil.profile(modify_element_property_local, page, name, value,
                    calls_to_print = 20, show_graphical_results = False)
The profiling results are shown in the Allplan trace window:
ncalls  tottime  percall  cumtime  percall filename:lineno(function)
     1    0.000    0.000    0.348    0.348 TowerCrane.py:179(modify_element_property_local)
     1    0.001    0.001    0.322    0.322 TowerCrane.py:685(draw_preview)
     1    0.225    0.225    0.225    0.225 TowerCrane.py:1045(select_elements)
     1    0.076    0.076    0.077    0.077 Utility.py:247(checking_collision)
     1    0.021    0.021    0.021    0.021 TowerCrane.py:322(on_preview_draw)
     1    0.000    0.000    0.006    0.006 SafetyZone.py:64(create_element)
     1    0.001    0.001    0.006    0.006 SafetyZone.py:89(create_geometry)
     1    0.005    0.005    0.005    0.005 SafetyZone.py:140(create_jib_safety_zone)
     1    0.000    0.000    0.004    0.004 Tower.py:74(create_element)
     1    0.000    0.000    0.004    0.004 Tower.py:133(create_geometry)
     1    0.000    0.000    0.003    0.003 BuildingElementPaletteService.py:346(update_palette)
     1    0.000    0.000    0.003    0.003 BuildingElementPalette.py:59(show)
     1    0.000    0.000    0.003    0.003 TowerHead.py:51(create_element)
     1    0.000    0.000    0.003    0.003 TowerHead.py:74(create_geometry)
     1    0.003    0.003    0.003    0.003 TowerHead.py:97(create_towerhead)
     1    0.000    0.000    0.002    0.002 Tower.py:282(create_tower)
    37    0.002    0.000    0.002    0.000 Utility.py:57(extrude)
     3    0.000    0.000    0.002    0.001 BuildingElementPalette.py:165(show_page_controls)
     1    0.000    0.000    0.002    0.002 Jib.py:64(create_element)
     1    0.000    0.000    0.002    0.002 Jib.py:103(create_geometry)
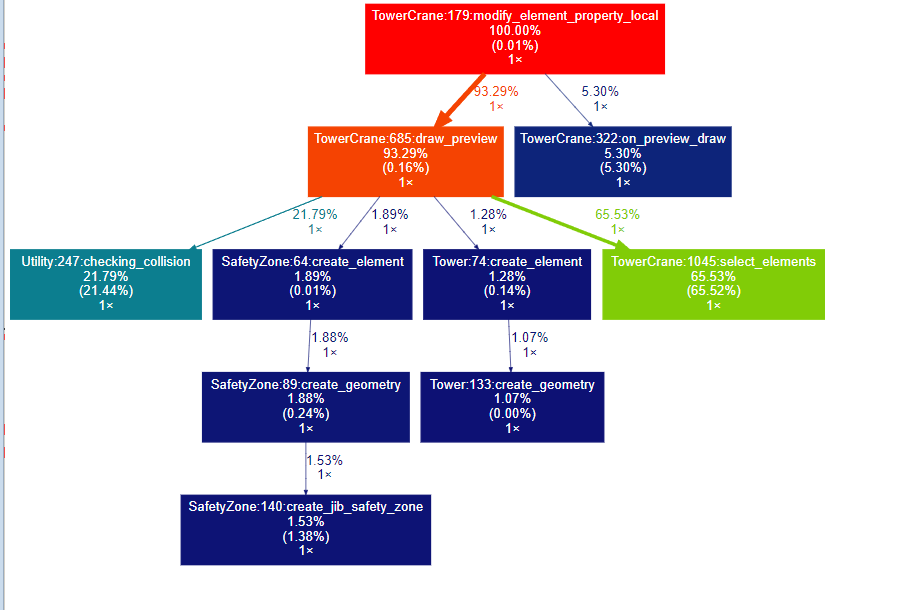
To make the results more visible, a graphical result of the profiling results can be displayed using the following tools:
gprof2dot
This is a Python module to convert the output from the used profiler into a dot graph. The installation is done with the help of the PythonPart InstallPythonPackage or by following steps below:
select Download files and download the package
unpack the files and copy the folder gprof2dot to the Allplan folder ..\Prg\Python\lib\site-packages
Graphviz
Graphviz is open source graph visualization software and can be installed from https://graphviz.org/
Finally, the parameter show_graphical_results needs to be set to True.
The graphical result of the profiling looks like this:
Inside the PythonParts script the profiling can be included e.g. in the function modify_element_property as follows
PROFILE_FUNCTION = True
...

def modify_element_property(self, page, name, value):
    ...

    if PROFILE_FUNCTION:
        return ProfileUtil.profile(modify_element_property_local, page, name, value,
                                   calls_to_print = 20, show_graphical_results = True)
    else:
        return modify_element_property_local(page, name, value)

def modify_element_property_local(self, page, name, value):
    ...