Performance profiling
If the created PythonPart has poor performance, it's useful to perform performance profiling of the Python source code. This can be done using different tools described below. Performance profiling is supported by the PythonParts framework for functions and lines and it is done using the class ProfileUtil
With this tool it is possible to do performance profiling of the functions. Implementation in the code can look as follows:
ProfileUtil.profile(modify_element_property_local, page, name, value,
                    calls_to_print = 20, show_graphical_results = False)
The profiling results are shown in the Allplan trace window:
ncalls  tottime  percall  cumtime  percall filename:lineno(function)
1    0.000    0.000    0.348    0.348 TowerCrane.py:179(modify_element_property_local)
1    0.001    0.001    0.322    0.322 TowerCrane.py:685(draw_preview)
1    0.225    0.225    0.225    0.225 TowerCrane.py:1045(select_elements)
1    0.076    0.076    0.077    0.077 Utility.py:247(checking_collision)
1    0.021    0.021    0.021    0.021 TowerCrane.py:322(on_preview_draw)
1    0.000    0.000    0.006    0.006 SafetyZone.py:64(create_element)
1    0.001    0.001    0.006    0.006 SafetyZone.py:89(create_geometry)
1    0.005    0.005    0.005    0.005 SafetyZone.py:140(create_jib_safety_zone)
1    0.000    0.000    0.004    0.004 Tower.py:74(create_element)
1    0.000    0.000    0.004    0.004 Tower.py:133(create_geometry)
1    0.000    0.000    0.003    0.003 BuildingElementPaletteService.py:346(update_palette)
1    0.000    0.000    0.003    0.003 BuildingElementPalette.py:59(show)
1    0.000    0.000    0.003    0.003 TowerHead.py:51(create_element)
1    0.000    0.000    0.003    0.003 TowerHead.py:74(create_geometry)
1    0.003    0.003    0.003    0.003 TowerHead.py:97(create_towerhead)
1    0.000    0.000    0.002    0.002 Tower.py:282(create_tower)
37    0.002    0.000    0.002    0.000 Utility.py:57(extrude)
3    0.000    0.000    0.002    0.001 BuildingElementPalette.py:165(show_page_controls)
1    0.000    0.000    0.002    0.002 Jib.py:64(create_element)
1    0.000    0.000    0.002    0.002 Jib.py:103(create_geometry)
Visualizing the results
To make the results more visible, a graphical result of the profiling results can
be generated. To do that, set the parameter show_graphical_results to True
and use the following tools:
gprof2dot
grprof2dot is a Python module to convert the output from the used profiler into a dot graph. The installation is done with the help of the PythonPart InstallPythonPackage.
Manual installation
- visit https://pypi.org/project/gprof2dot/
- select Download files and download the package
- unpack the files and copy the folder gprof2dot to the Allplan folder ..\Etc\PythonParts-site-packages (if it doesn't exist, create it)
Graphviz
Graphviz is an open source graph visualization software.
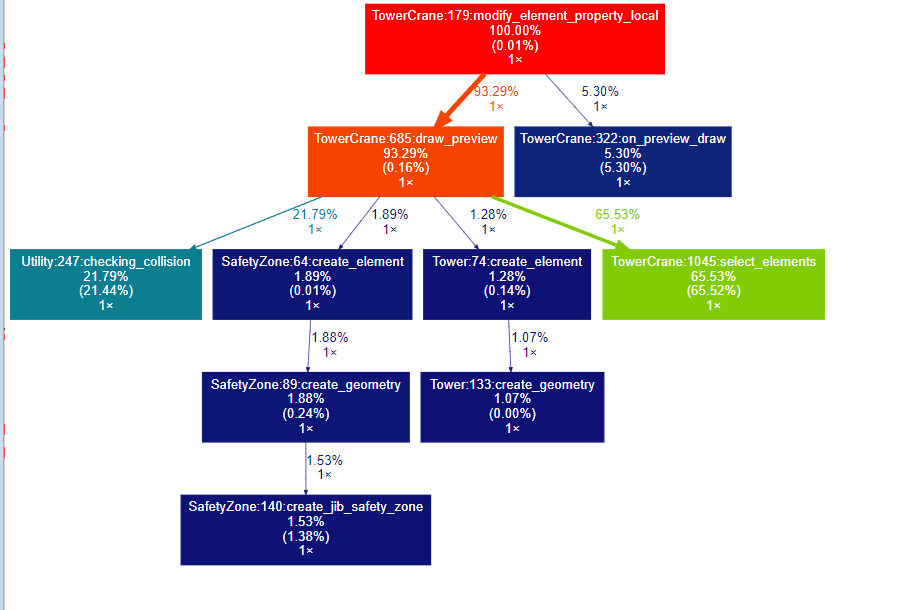
Here is an example of how the graphical result of profiling may look like:
Here is an example of how profiling can be included in the PythonPart script
in the function modify_element_property
PROFILE_FUNCTION = True
...

def modify_element_property(self, page, name, value):
    ...

    if PROFILE_FUNCTION:
        return ProfileUtil.profile(modify_element_property_local,
                                   page, name, value, calls_to_print = 20,
                                   show_graphical_results = True)
    else:
        return self.modify_element_property_local(page, name, value)

def modify_element_property_local(self, page, name, value):
Profiling an Interactor PythonPart
The PythonParts framework offers the possibility to profile the source code of an Interactor PythonPart which will be executed after a left mouse button click. To do this, the Python package keyboard must be installed (use the PythonPart InstallPythonPackage to do that). Profiling can be executed by pressing the ctrl key while clicking the left mouse button.
Manual Installation
Manual installation of the keyboard package can be done by following the steps:
- download the package from here
- unpack the files and copy the folder keyboard to the Allplan folder ...\Etc\PythonParts-site-packages (if it doesn't exist, create it)
The installation is done with the help of the PythonPart InstallPythonPackage.
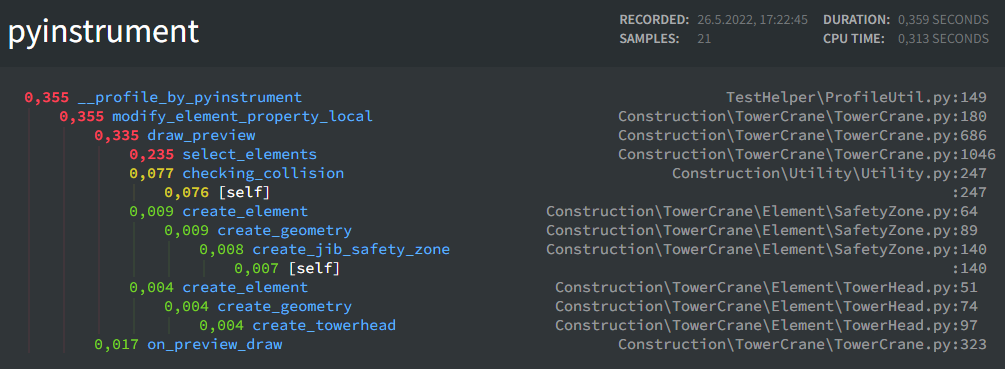
With this tool it is possible to do performance profiling of the functions. Implementation in the code can look as follows:
ProfileUtil.profile(modify_element_property_local, page, name, value,
                    profiler_type = ProfilerType.PY_INSTRUMENT)
Here is an example of how profiling can be included in the PythonPart script
in the function modify_element_property:
PROFILE_FUNCTION = True
...

def modify_element_property(self, page, name, value):
    ...

    if PROFILE_FUNCTION:
        return ProfileUtil.profile(modify_element_property_local, page, name, value,
                                   profiler_type = ProfilerType.PY_INSTRUMENT))
    else:
        return self.modify_element_property_local(page, name, value)

def modify_element_property_local(self, page, name, value):
    ...
The installation is done with the help of the PythonPart InstallPythonPackage.
With this tool it is possible to do performance profiling of the lines. Implementation in the code can look as follows:
ProfileUtil.profile(modify_element_property_local, page, name, value,
                    profiler_type = ProfilerType.LINE_PROFILE)
The profiling results are shown in the Allplan trace window:
Function: select_elements at line 1046

Line #      Hits         Time  Per Hit   % Time  Line Contents
==============================================================
1046                                               @use_line_profiler
1047                                               def select_elements(self):
1048
1049         3          0.2      0.1      0.0          point, radius = self.calculate_point_to_select()
1050         3          0.1      0.0      0.0          world_point = AllplanGeo.Transform(point, self.trans_matrix)
1051         3          0.0      0.0      0.0          view_world_projection = self.coord_input.GetViewWorldProjection()
1052         3          0.0      0.0      0.0          new_point = view_world_projection.WorldToView(world_point)
1053
1054                                                   # Big polygon for Crane
1055         3          0.0      0.0      0.0          polygon1 = AllplanGeo.Polygon2D()
1056         3          0.0      0.0      0.0          diff_angle = math.pi*2/36
1057         3          0.0      0.0      0.0          angle = diff_angle/2
1058         3          0.0      0.0      0.0          rad = radius/math.cos(angle)
1059       111          0.0      0.0      0.0          for _ in range(0, 36):
1060       108          0.2      0.0      0.0              polygon1 += AllplanGeo.Point2D(rad * math.cos(angle), rad * math.sin(angle))
1061       108          0.0      0.0      0.0              angle += diff_angle
1062         3          0.0      0.0      0.0          polygon1 += polygon1[0]
1063
1064         3          0.0      0.0      0.0          move_matrix = AllplanGeo.Matrix2D()
1065         3          0.0      0.0      0.0          move_matrix.SetTranslation(AllplanGeo.Vector2D(new_point))
1066         3          0.0      0.0      0.0          crane_polygon = AllplanGeo.Transform(polygon1, move_matrix)
1067
1068         3          0.0      0.0      0.0          condition = AllplanIFW.SelectElementsService.eSelectCondition.SELECT_ALL
1069         3          0.0      0.0      0.0          selected_filter = AllplanIFW.SelectionQuery()
1070
1071         6        691.7    115.3     99.9          elements = AllplanIFW.SelectElementsService.SelectByPolygon(self.doc, crane_polygon, view_world_projection,
1072         3          0.0      0.0      0.0                                                                         condition, selected_filter)
1073
1074         3          0.0      0.0      0.0          return elements
Here is an example of how profiling can be included in the PythonPart script
in the function modify_element_property:
PROFILE_FUNCTION = True
...

def modify_element_property(self, page, name, value):
    ...

    if PROFILE_FUNCTION:
        return ProfileUtil.profile(modify_element_property_local, page, name, value,
                                   profiler_type = ProfilerType.LINE_PROFILE))
    else:
        return self.modify_element_property_local(page, name, value)

def modify_element_property_local(self, page, name, value):
    ...
Each function whose lines are to be included in the line profiling must be decorated as follows