Debugging
PythonPart scripts can be executed with debugging enabled. Before starting, an additional Python Package needs to be installed in the Allplan environment.
Install the right debugger
Which package is needed, depends on the Allplan Version installed:
| Tool | Allplan Version |
|---|---|
| debugpy | 2021-1-6 and higher |
| ptvsd 4.3.2 | 2021-1-5 and lower |
Both of the packages can be installed with our tool, which is described here.
Manual installation
The instalation can also be done manually, by doing following steps:
- click on the link provided above
- select Download files
- select the newest version for download
- open the downloaded .zip file and the folder src
- copy the folder debugpy to the Allplan folder ..\Etc\PythonParts-site-packages (if it doesn't exist, create it)
- click on the link provided above
- select Download files
- select ptvsd-4.3.2.zip from the file list
- open the downloaded .zip file and the folder src
- copy the folder ptvsd to the Allplan folder ..\Etc\PythonParts-site-packages (if it doesn't exist, create it)
Start debugging support
Before a PythonPart script can be debugged, the Python package for the debugging support must be started in Allplan. To do this, the PythonPart script StartPythonDebug needs to be executed. The script is located in the folder ...\etc\Examples\PythonParts\ToolsAndStartExamples
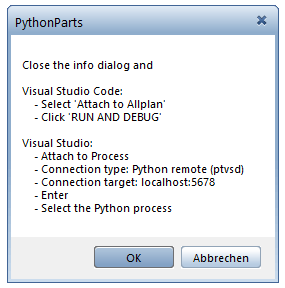
After the script is started, a message box is displayed (see below). Now press OK before proceeding to the next steps.
Debug with your IDE
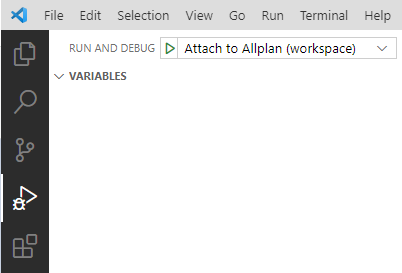
- Press the Run and Debug button or hit Ctrl+Shift+D
- Select Attach to Allplan from the RUN AND DEBUG combo box
- Press Start Debugging
After this steps, Visual Studio Code is connected to Allplan and the PythonPart scripts can be debugged with the provided functionality shown in here
I don't see Attach to Allplan option in the combo box!
If you created your Workspace in Visual Studio by following steps in this chapter, the entry Attach to Allplan should already be available in the RUN AND DEBUG combo box. If that's not the case, make sure following tags exist in the launch part of the current Visual Studio Code workspace file:
- select Debug and Attach to Process
- select Python remote for Connection type:
- input localhost:5678 for Connection target:
- select the Python process from the Process list
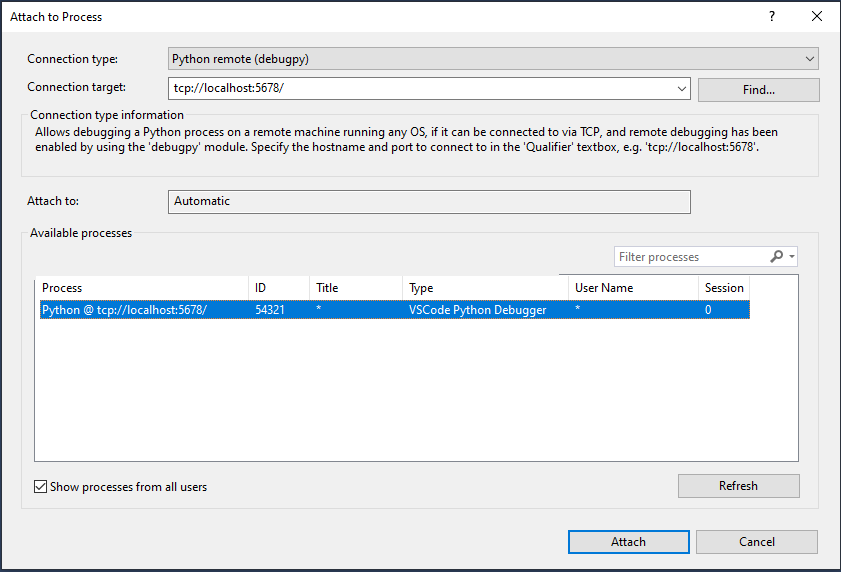
After this steps, Visual Studio is connected to Allplan and the PythonPart scripts can be debugged with the provided functionality.
pdb is a Python debugger, which also can be used to debug PythonPart. To use this tool, the Allplan Trace Window must be activated. Normally you inset the following code snippet:
into the script code at the location where you want to break into the debugger. You can then step through the code that is following this statement.
def create_geometry(self, build_ele):
import pdb
pdb.set_trace()
length = build_ele.Length.value
width = build_ele.Width.value
line = AllplanGeo.Line2D(0, 0, 0, width/2)
> c:\programdata\nemetschek\2021_visualscripting\2021\etc\pythonpartsscripts\basisexamples\curveelements.py(123)create_geometry()
-> length = build_ele.Length.value
(Pdb) n
> c:\programdata\nemetschek\2021_visualscripting\2021\etc\pythonpartsscripts\basisexamples\curveelements.py(124)create_geometry()
-> width = build_ele.Width.value
(Pdb) length
1000.0
(Pdb) n
> c:\programdata\nemetschek\2021_visualscripting\2021\etc\pythonpartsscripts\basisexamples\curveelements.py(128)create_geometry()
-> line = AllplanGeo.Line2D(0, 0, 0, width/2)
(Pdb) n
> c:\programdata\nemetschek\2021_visualscripting\2021\etc\pythonpartsscripts\basisexamples\curveelements.py(130)create_geometry()
-> polyline = AllplanGeo.Polyline2D()
(Pdb) line
Line2D(0, 0, 0, 1000)
(Pdb)
Trace window
The Allplan trace window is a useful tool for the PythonPart development and we strongly recommend enabling it. This can be done directly in Allplan application by pressing Ctrl+F3 and setting the option Write into window.
When an error occurs in the Python script, it is reported in the trace window. In addition, a lot of information reported by the PythonParts framework is displayed. The PythonPart SetTraceLevel, found in ...\PythonPartsExamples\ToolsAndStartExamples, can be used to set the trace level.
If a crash occurred during the execution of a PythonPart, the trace output should be changed to Write into file. All trace output is now written to the file allplan_python.out, which is located in the TMP directory of Allplan.